Home · Technology
Proprietary NMR + satellite imaging
Hydrocarbons, minerals and groundwater are identified directly at depth, remotely and non-invasively. The complete technology and its five-stage process are documented below.
Scientific foundation
Every atomic element and molecular compound exhibits a distinct electromagnetic signature, a quantum fingerprint comparable to a barcode. That signature is detected directly.
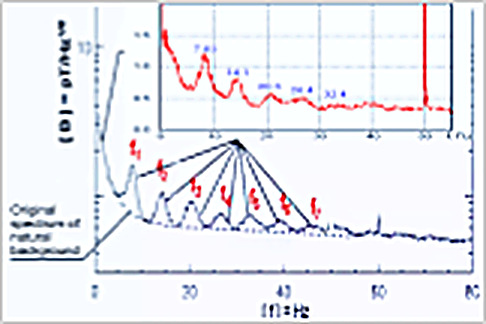
Nuclear Magnetic Resonance (NMR) is the phenomenon by which atomic nuclei absorb and re-emit electromagnetic radiation at precise resonance frequencies. Oil, gas, water, CO₂ and every mineral respond at their own characteristic frequency.
That signature is amplified and read remotely through the Earth's crust by means of satellite imagery and proprietary gel filters tuned to the spectral frequency of the target compound. Detection is direct and binary: the signature is either present or absent.
Analogy. In a room where every instrument is playing at once, the method operates as a microphone whose filter isolates the frequency of the instrument under investigation.
→ Then they interpret
→ Direct identification
The process
The following are defined in close collaboration with each client:
Imagery is acquired from 14 satellite constellations, among them Landsat 8/9 (NASA), RADARSAT-2 (Canadian Space Agency) and TerraSAR-X (German Aerospace Center). In combination, these constellations permit the entire planet to be scanned every eight days. Up to 4,000 very-high-resolution digital images of the target area are acquired per project.
Band allocation. Hyperspectral (VNIR–SWIR) delineates ore-body and reservoir boundaries; microwave/SAR maps faults and fractures under cloud or canopy; ultraviolet highlights near-surface metals; visible refines targets; and far-infrared traces deep faults through thermal anomalies.
This is the core of the method: nine steps in which each satellite image is turned into physical plates, marked with the target's quantum signature, amplified in a research reactor under nuclear magnetic resonance, and read back as digital data. It is a proprietary sequence predicated on the fact that every element resonates differently depending on its spin.
Each digital image is converted into a physical analog image plate using proprietary light-modulating equipment that manipulates intensity, phase and polarization.
The electromagnetic data is recorded onto high-fidelity silver-halide crystal plates, preserving every wavelength and frequency of the scene.
A proprietary resonant gel — formulated with nanoparticles of the element of interest, rare earths and activators — is sputtered onto the plate to mark the target's unique quantum profile.
An organometallic matrix plate is created from a metal-carbon substrate to act as a passive physical filter, isolating the quantum signature of the element of interest.
The stacked plates are exposed to gamma emissions in a research-oriented IR-100 nuclear reactor to amplify the specific signals of the target elements.
A nuclear magnetic resonance field, induced by the gamma rays, makes the plates resonate selectively according to the spin properties of each element.
Gamma and equivalent hard X-rays are emitted and displaced outside the NMR zone, carrying the filtered response of the target.
An X-ray film captures only the filtered signals, creating a deposit locator plate for each analog image — the final detection layer.
The films are chemically developed and scanned at high resolution, converting the physical findings back into digital data.
The role of spin. Some elements resonate strongly and are readily detected; others do not. Where a target is weakly resonant, the strongly resonant companion elements present in the same rock are used to guide the search, so that a weakly resonant target may be located by association.
Once the plates have been read, the anomalies are analyzed, tied to precise coordinates and turned into maps. Depth and volume come from the parallax method: the apparent shift of a target between images taken from satellites at different orbital inclinations reveals how deep it lies and how large it is.
Densitometric and spectral analysis of the gamma-induced anomalies confirms occurrences directly linked to the presence of the target element.
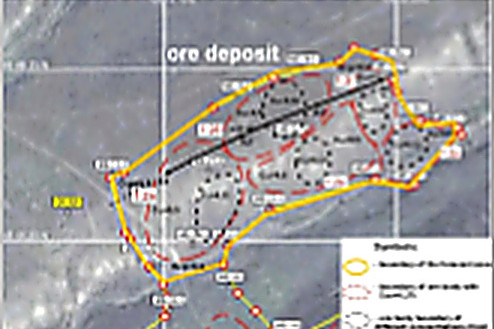
The confirmed anomalies are superimposed on visible imagery of the license area with precise geographic coordinates in WGS-84.
Spatial maps are superimposed to visualize the estimated concentration and distribution of the target across the project area.
All the data is cross-validated and synthesized into a final report. It complements — it does not replace — established reserves-reporting frameworks, and is designed to be handed to a client's own technical team or independent evaluator.
Contours and coordinates of every anomaly, in WGS-84 over the concession.
Depths of occurrence and approximate thicknesses of the target horizons.
Optimal coordinates and schematic depth columns to focus the drilling program.
Spatial distribution and estimated concentration of the target across the area.
The complete process, from the first satellite pass to the final report.
Up to 4,000 very-high-resolution images of the area are acquired.
Each digital image is turned into a physical plate.
The data is recorded onto silver-halide crystal plates.
A gel carrying nanoparticles of the target element marks the plate.
An organometallic plate isolates the signature of the element.
The plates are exposed to gamma emissions in a research reactor.
A magnetic field makes each element resonate according to its spin.
The filtered response of the target leaves the resonance zone.
An X-ray film records only the filtered signals.
The films are developed and scanned back into digital data.
The anomalies linked to the target element are confirmed.
Each anomaly is given precise coordinates in WGS-84.
Superimposed maps show the estimated distribution and concentration.
All the data is synthesized into the final report for the client.
Scope and limitations
Deliverables
Every deliverable is georeferenced (depth and coordinates) and formatted to integrate directly with the client's databases.
Georeferenced polygons with precise coordinates for each identified zone, exportable as shapefiles for GIS and seismic platforms.
Top and base depth of each anomaly, derived from the attenuation of the NMR signal, with a thickness estimate per zone.
Vertical columns showing the lithological distribution and the position of each anomaly at depth.
Drilling coordinates optimized per anomaly from the contour centroid and the pressure-gradient analysis, in order to improve the probability of intersecting the anomaly.
Categorical separation of hydrocarbons, water-saturated formations and CO₂, together with explicit gas-cap alerts.
Pressure range per anomaly for safe well planning, together with a preliminary estimate of the inferred resource derived from the geometry.
Comparison
In the comparison below, accuracy is approximately 50% higher than that of the remote technologies assessed.
Remote operation, element identification and depth of investigation are integrated in a single workflow, with an effectiveness comparable to fieldwork and without the associated mobilization costs.
Remote acquisition is combined with a level of precision comparable to locally applied methods.
| Comparable attributes | Inside Earth (NMR) | Synthetic aperture radar | Satellite imagery (hyper and multispectral) | Muon tomography | Ambient noise tomography | Electrical resistivity tomography | NI 43-101, seismic, gravimetry and electromagnetics |
|---|---|---|---|---|---|---|---|
| Remote solution (non-intrusive) | ✓ | ✓ | ✓ | ✗ | ✗ | ✗ | ✗ |
| Detects all relevant minerals and hydrocarbons | ✓ | Not specified | Limited | ✓ | Limited | Limited | ✗ |
| Depth | Up to 24,600 ft (7,500 m) | Limited | ✗ | Limited | Limited | Limited | ✓ |
| +70% accuracy | ✓ | Not specified | ✗ | Not specified | ✓ | Limited | Limited |
| In service since 2024 | ✓ | Not specified | ✓ | Not specified | ✓ | ✓ | ✓ |
| Complementary to seismic / NI 43-101 | Guides seismic coverage, delineates reservoirs and characterizes the content of the detected anomalies | Limited | Limited | Limited | N/A | Limited | N/A |
Seismic surveys are not replaced. The method operates as a pre-seismic screening tool that directs them: seismic acquisition is deployed only where presence has already been confirmed.
Exploration cycle
The method is deployed ahead of conventional techniques. These are not replaced; their effectiveness is increased through compression of the early stages of the cycle.
Application to a specific asset
Provide the coordinates of a target area and the element of interest. The schedule and the deliverables will be defined by the Inside Earth technical team in an initial meeting, without obligation.