3D characterization of gold and copper deposits — anomalies, depths and volumes detected without a single physical drill hole.
View mining cases ↓Hydrocarbon reserves remotely delineated — anticlines, trap layers and pay volumes without exploratory drilling.
View oil & gas cases →Aquifers, water tables and deep groundwater reserves mapped from surface with depth and volume resolution.
View water cases →From the Arizona desert to the Peruvian Andes: gold, silver and copper read from orbit and confirmed in the laboratory. Depths, dimensions and tonnages are established before mobilization to site.
17 areas with gold shows delineated at surface and a network of 11 tectonic faults, over a 12.4 sq mi (32 km²) licensed area.
6 industrial gold anomalies (≥ 1 g/t) with 114.3 million tonnes forecast, depths verified down to 16,410 ft (5,003 m).
15 copper anomalies at the 0.2% Cu threshold mapped with 3D geometry, around an active open-pit operation.
Commissioned by King Global Ventures Inc. to evaluate a licensed area of 12.4 sq mi (32 km²) in the Black Canyon area of Yavapai County, Arizona. Stage I of the remote survey delineated 17 areas with gold shows at the surface and the network of 11 tectonic faults that controls them, without drilling any boreholes.
View King Global publicationThe survey was carried out on satellite imagery of different frequency bands — visible, ultraviolet and infrared — transformed into analog plates and treated with chemical reagents specific to each metal. The recognition samples come from the American Assay Laboratories reports and were checked against eight core sampling reference points supplied by King Global. Infrared processing revealed the network of tectonic faults that crosses the block, and the gold occurrences are confined to it: a structural correlation that supports the prospectivity of the area for industrial anomalies of gold and associated metals.
17 areas with shows (SH-1 to SH-17) · background concentration CAu = 0.02 g/t · network of 11 tectonic faults
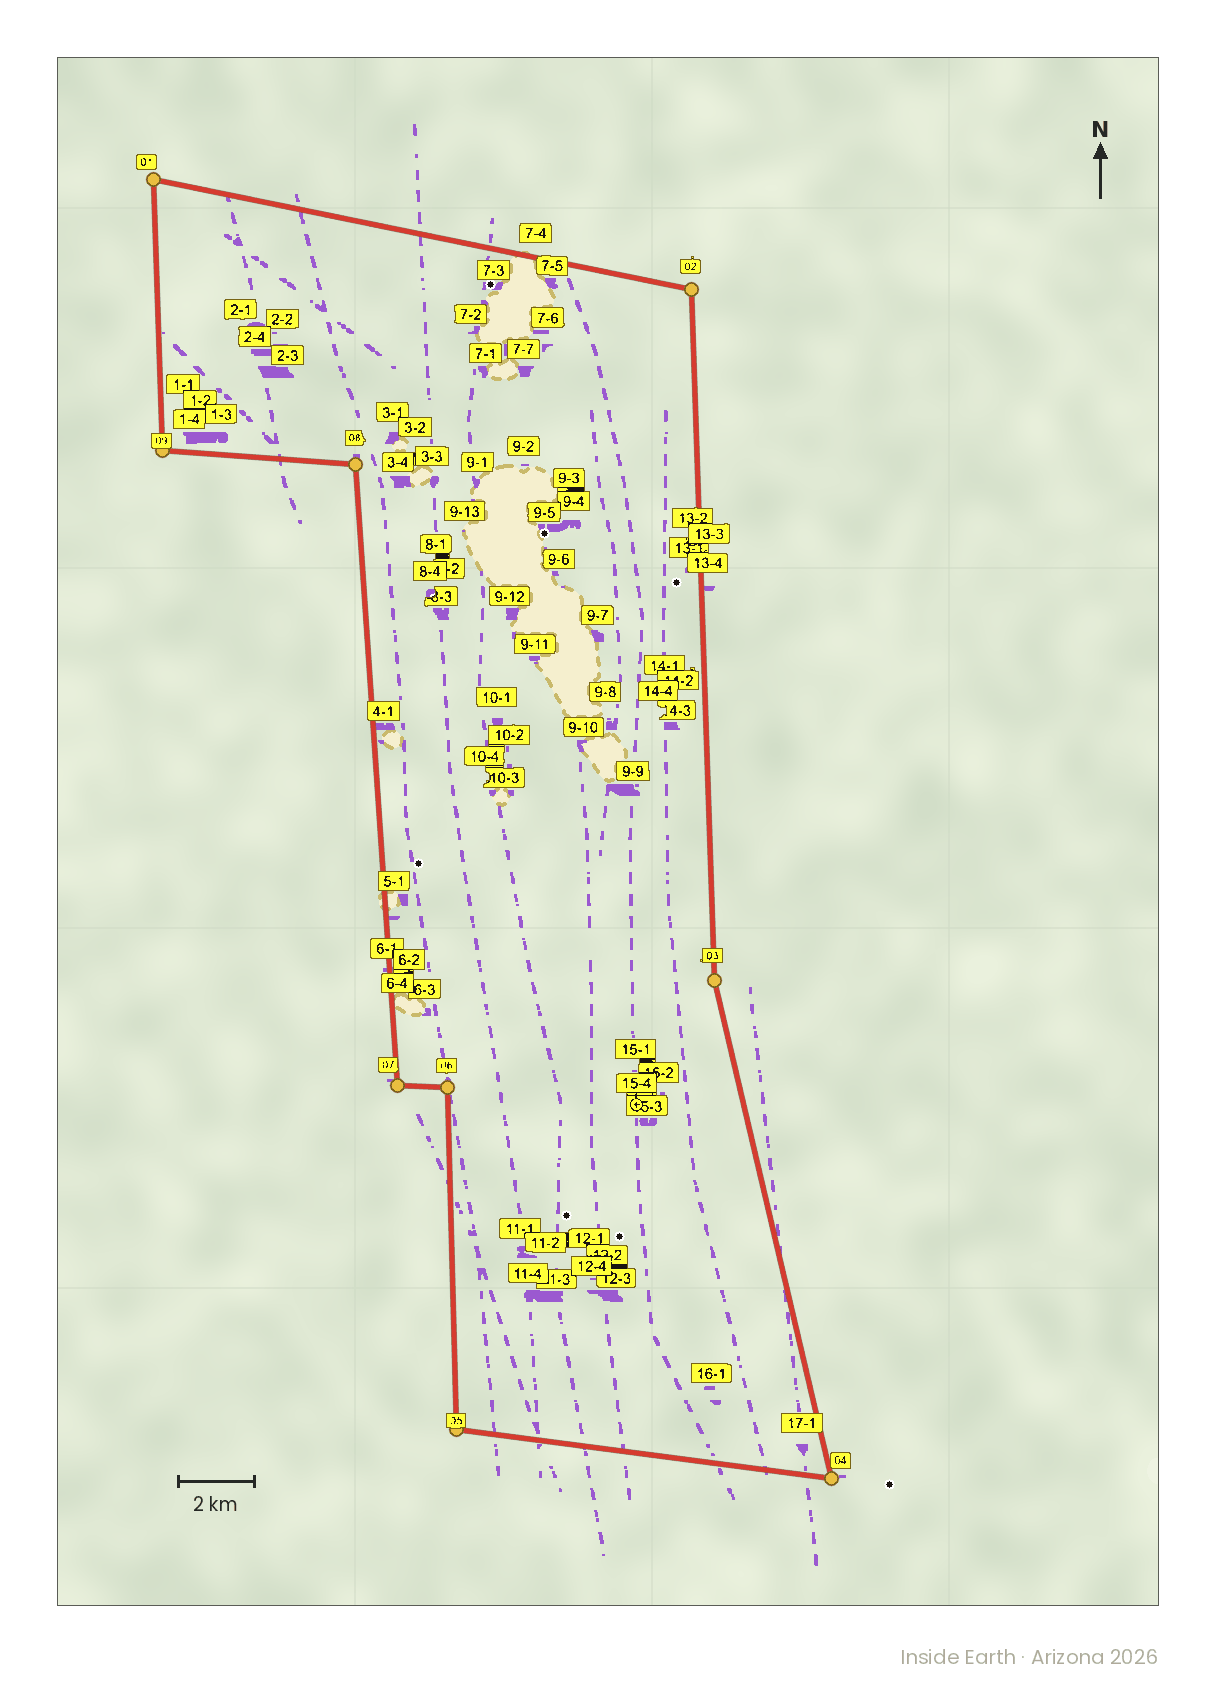
Outlines of areas SH-1 to SH-17 at the background concentration threshold, plotted on satellite imagery with their boundary points.
Eleven faults identified from infrared imagery, crossing the block from north to south and from northwest to south.
Boundary points of the areas, points along the faults and vertices of the licensed area, all in the WGS84 datum.
The gold occurrences are confined to the fault network, which raises the likelihood of industrial anomalies forming near those structures.
Contours at the cut-off content of 1 g/t Au or more within the halos already identified.
Schematic deep sections at the measurement points, down to depths of 9,840 ft (3,000 m).
Delineation of Ag and Cu mineralization with industrial content in the ore.
Prioritized targets to intersect the highest-ranked anomalies.
Commissioned by Cóndor Precious Metals to evaluate 1.4 sq mi (3.6 km²) in the Cauca-Patía inter-Andean valley. Two consecutive stages of remote exploration detected 6 industrial gold anomalies with a forecast ore volume of 45.7 million m³ (≈ 114.3 million tonnes at CAu ≥ 1 g/t).
The Cauca-Patía inter-Andean valley constitutes a metallogenic belt of epithermal gold with favorable geological conditions: young magmatism, an omnipresent fault network (Romeral suture to the east, Kali-Patía system to the west), reactive rocks and documented hydrothermal alteration.
That said, the belt remains insufficiently characterized in comparison with the Cauca belt to the west. Cóndor Precious Metals accordingly commissioned a remote prospecting study intended to resolve two questions in parallel: the presence of detectable gold mineralization within the block and, if confirmed, the dimensions, depths and volumes to be forecast prior to committing investment to drilling.
Two consecutive stages were executed over four months by means of satellite remote sensing and laboratory spectral processing alone (Saturno-4 EPM spectrophotometer, patented gels, sputtering technique).
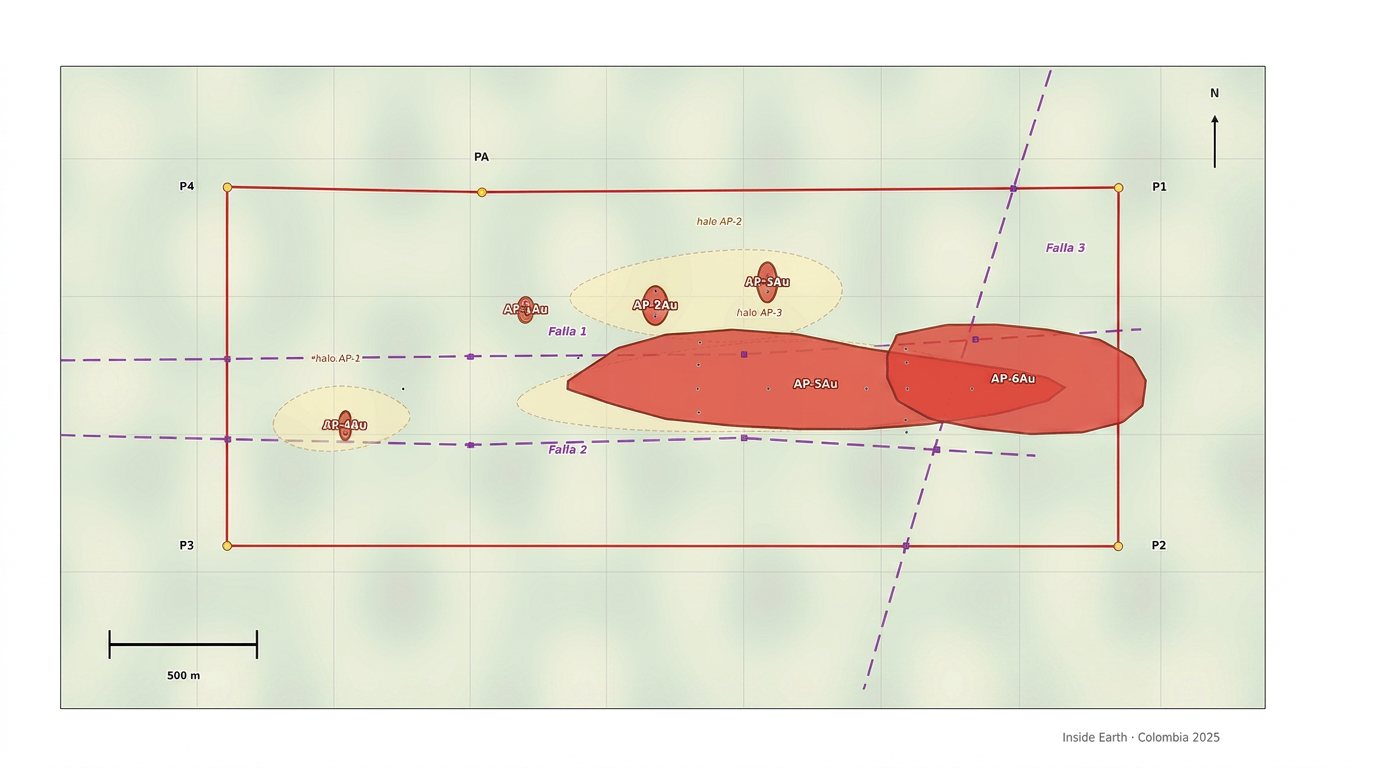
Stage I (June-August): identified three Au dispersion halos at the background concentration CAu = 0.06 g/t and mapped the network of three tectonic faults crossing the area.
Stage II (August-September): within the halos detected six industrial bodies at the threshold CAu = 1 g/t, measuring depth, thickness, dip angle and calculating forecast volumes for each anomaly.
Pale yellow shows the Stage I halos (background concentration, CAu ≥ 0.06 g/t). Bold red marks the six industrial bodies of Stage II (CAu ≥ 1 g/t). The fault network and the AOI outline complete the geological context.
6 industrial gold anomalies · CAu ≥ 1 g/t · 3 contextual halos (Stage I, ≥ 0.06 g/t) · 3 tectonic faults
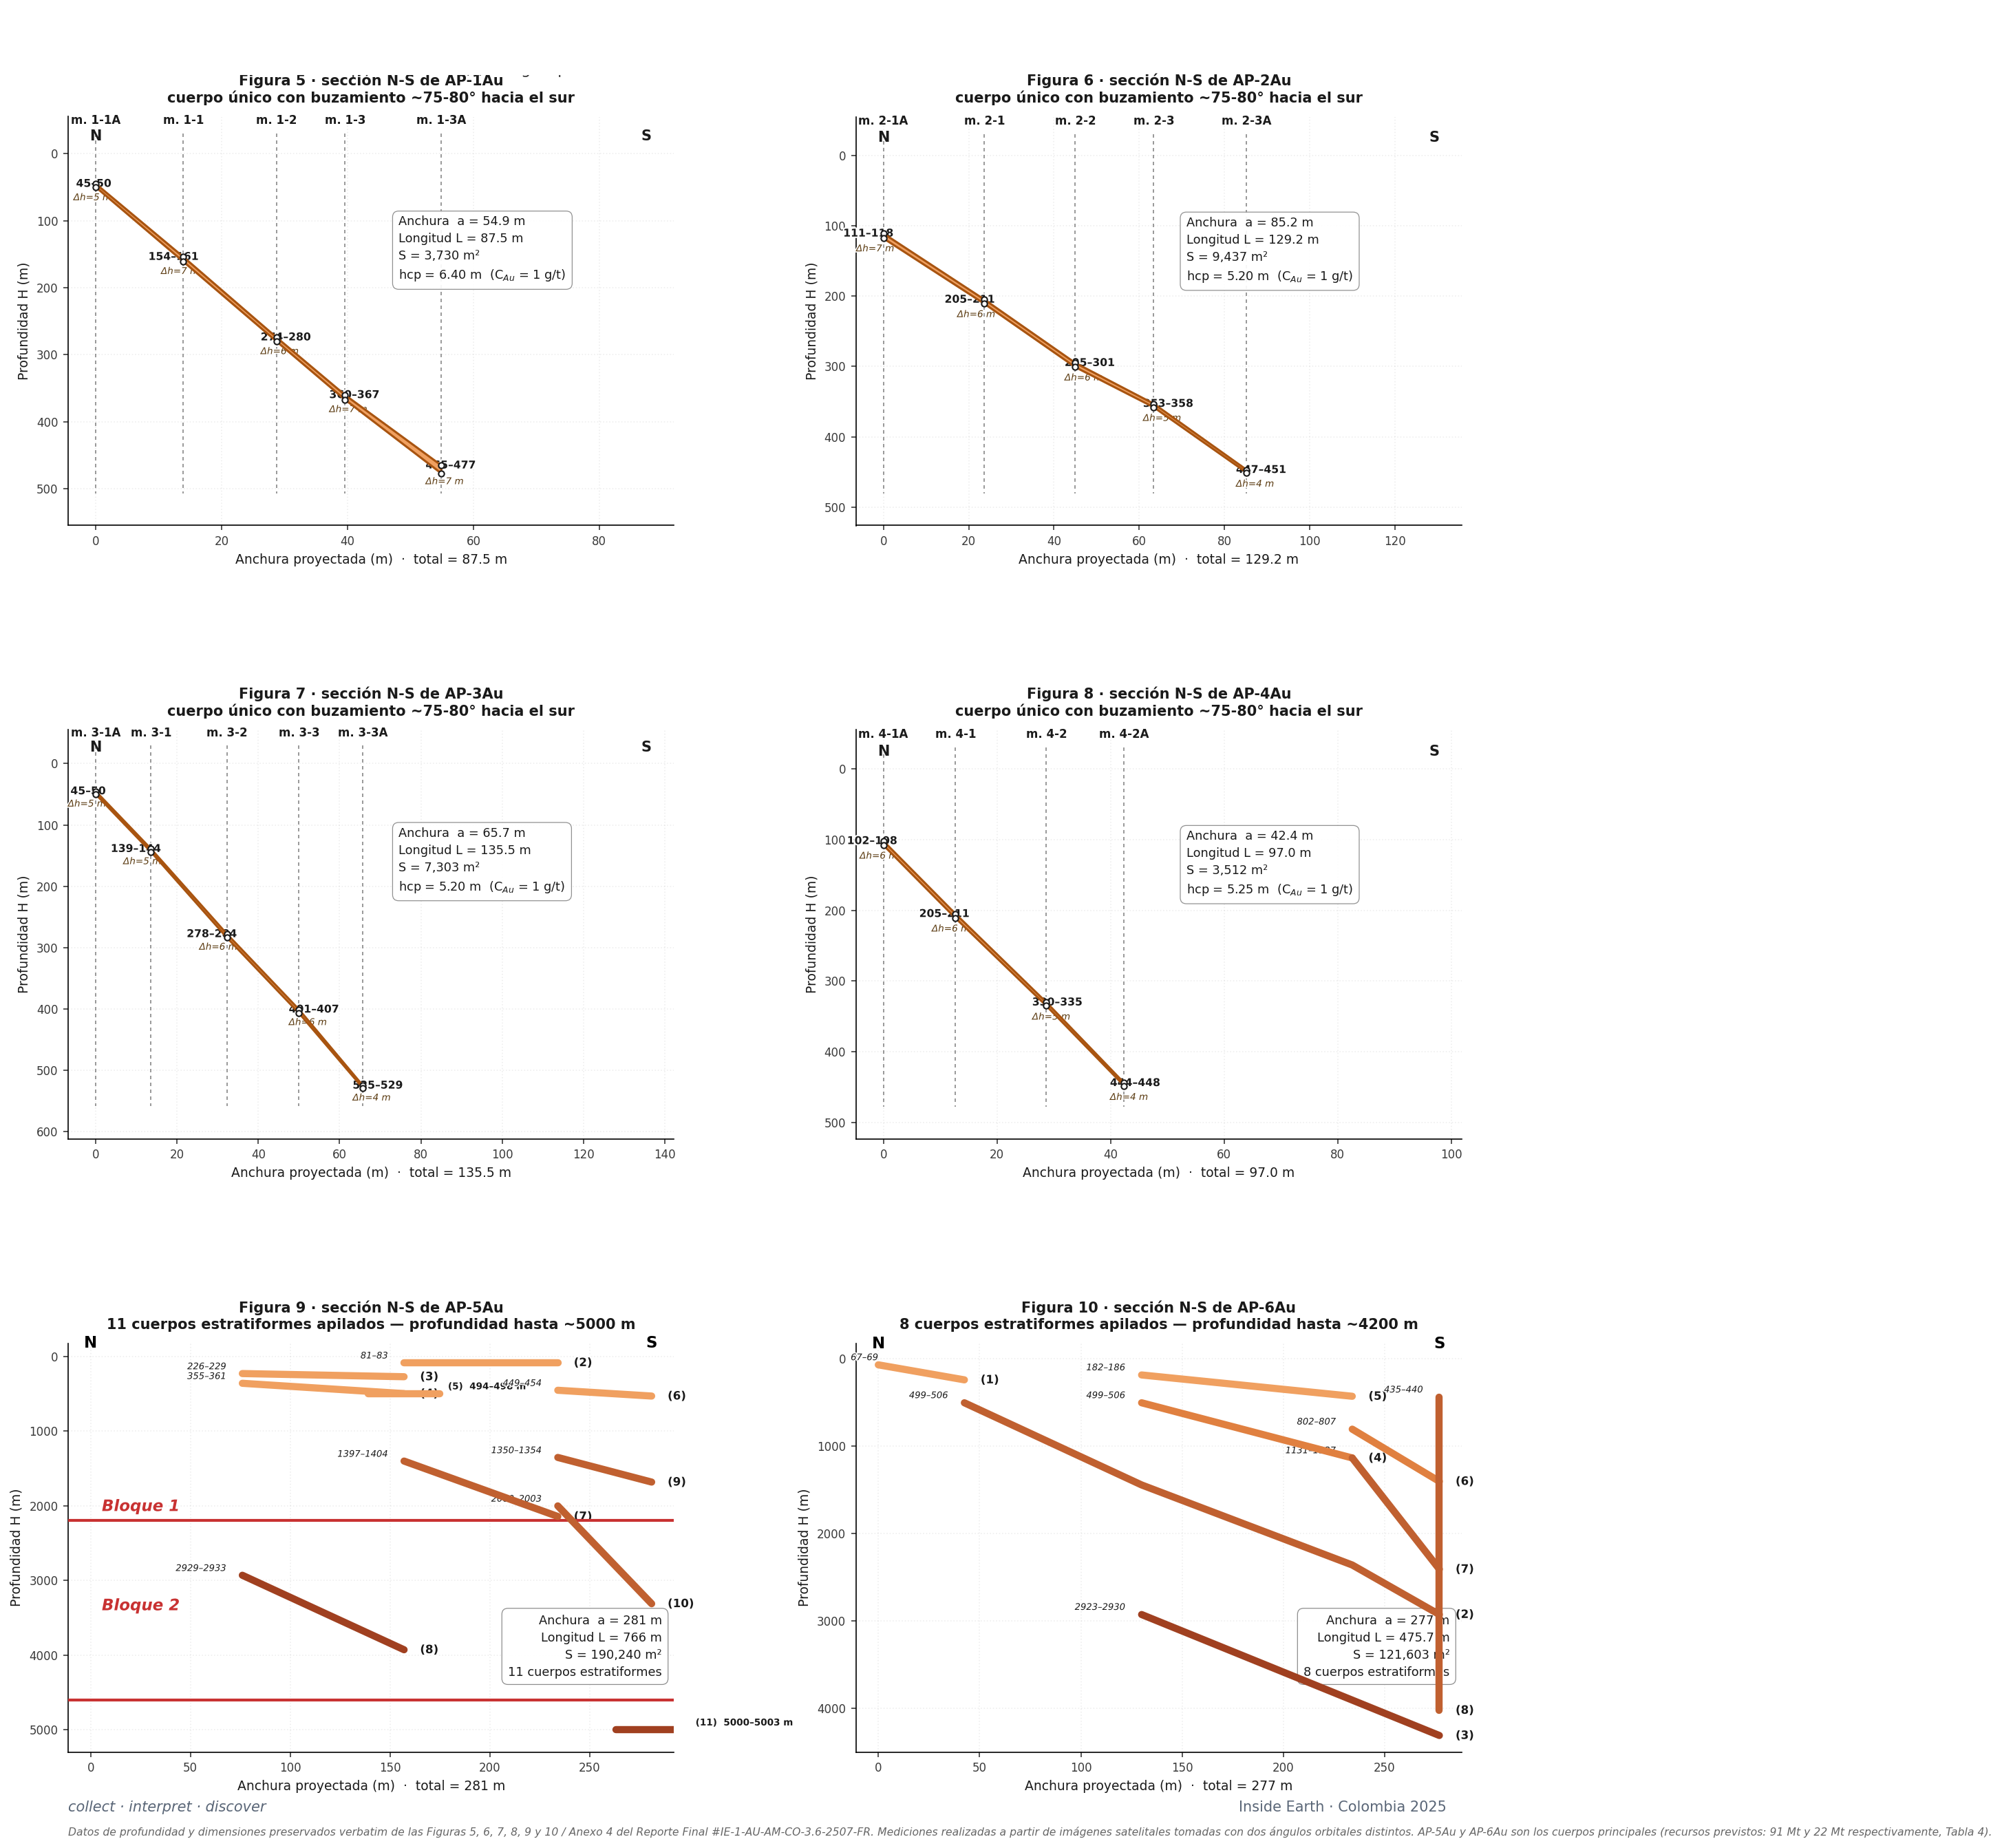
The first four are single bodies with ~75-80° dip towards the south. The last two — AP-5Au with 11 stratiform bodies and AP-6Au with 8 — are the principal findings: deep deposits of stacked stratiform architecture, with multiple mineralized horizons concentrating the bulk of the forecast resource.
Five measurements on the N-S profile (1-1A, 1-1, 1-2, 1-3, 1-3A) + two E-W edge points. Clean lenticular body.
Dipping N-S profile + horizontal level at ~1,160 ft (~354 m) visible on the E-W cross section (Figure 6A). Complex geometry.
The deepest among the compact bodies. Mineralization detected almost at surface (148 ft / 45 m). Suitable shallow drilling target.
The smallest of the four compact bodies. Isolated to the west of the block, within the Stage I AP-1 halo.
The principal discovery of the study. Eleven stratiform bodies stacked from ~262 ft (~80 m) to the technology's detection limit (16,410 ft / 5,003 m). The system is structured into two tectonic blocks separated by discontinuities at ~7,220 ft (~2,200 m) and ~15,090 ft (~4,600 m) depth. S = 47 acres (190,240 m²) of effective mineralized area · ≈ 91 million tonnes forecast at CAu ≥ 1 g/t.
The second large deposit, east of AP-5Au. Similar stratiform structure but with smaller vertical extent. ≈ 22 million tonnes forecast.
The four compact bodies (AP-1Au — AP-4Au) are single 16-23 ft (5-7 m) thick lenses with a 75-80° dip to the south. AP-5Au and AP-6Au reveal stratified structures with multiple layers separated by hundreds to thousands of meters of barren rock.
6 industrial gold anomalies · N-S profiles · CAu ≥ 1 g/t · depths verified down to 16,410 ft (5,003 m)
| Anomaly | Depth H (m) | a (m) | L (m) | S (m²) | V (m³) | Resources (t) |
|---|---|---|---|---|---|---|
| AP-1Au | 45 – 477 | 70 | 430 | 30,100 | 96,320 | 240,800 |
| AP-2Au | 110 – 450 | 110 | 360 | 391,600 | 102,960 | 257,400 |
| AP-3Au | 45 – 529 | 120 | 500 | 60,000 | 156,000 | 390,000 |
| AP-4Au | 102 – 488 | 80 | 355 | 28,400 | 74,550 | 186,375 |
| AP-5Au | 50 – 5,003 (11 bodies) | 281 | 766 | 16,768,500 | 36,397,900 | 90,994,750 |
| AP-6Au | 67 – 4,314 (8 bodies) | 277 | 475,7 | 3,411,300 | 8,884,950 | 22,212,375 |
| Total · CAu ≥ 1 g/t · ρ = 2.5 t/m³ | 20,689,900 | 45,712,680 | 114,281,700 | |||
45.7 million m³ of forecast ore at CAu ≥ 1 g/t across the six anomalies (ρ = 2.5 t/m³).
Mineralization detected at AP-5Au at the technology's detection limit depth (measurements made down to 22,970 ft / 7,000 m).
Recommended minimum drill-hole depth range to confirm the surface anomalies.
Geometry, depth and thickness obtained without drilling or prior boreholes — the operator can visualize what lies beneath each point of the block before investing a single meter of drilling.
Data shown is for illustrative purposes.
Data shown is for illustrative purposes.
11 in AP-5Au · 8 in AP-6Au — each with top, bottom, length, width and thickness measured.
Total tonnage at CAu ≥ 1 g/t calculated anomaly by anomaly (Table 5, Annex 3).
From shallow mineralization (164 ft / 50 m) down to the technology's detection limit.
Combined footprint of AP-5Au + AP-6Au over the Gloriosa block (311,843 m²).
Each body in the model corresponds to a mapped gold mineralization whose spatial position reflects the measurements taken during the remote campaign. The chromatic gradient encodes depth: warm tones identify the shallowest bodies, and therefore the most accessible for a first stage of exploitation. The three horizontal slices section the volume at –656 ft (–200 m), –4,590 ft (–1,400 m) and –9,840 ft (–3,000 m), showing the active spatial footprint at each elevation.
Coordinates of the contours at the 0.06 g/t threshold (dispersion halos) and at the 1 g/t industrial threshold (anomalies).
Figures 5, 6, 6A, 7, 8, 9, 9A, 10, 10A: N-S and E-W cross sections for each anomaly with top, bottom and thickness per measurement point.
Volume V (m³) and tonnage P (t) calculated for each anomaly. Total 114.3 Mt at CAu ≥ 1 g/t (Table 4 + Table 5, Annex 3).
Five prioritized targets per anomaly (points No. 1, 2, 3, 4, 5) with coordinates and minimum drill depth of 262-984 ft (80-300 m).
From a practically unknown zone to a complete resource catalog in less than a quarter, with no invasive field work.
No roads, no platforms, no drilling muds — relevant in the sensitive territory of the inter-Andean valley with vegetation and communities.
Each of the 30 confirmation wells targets an anomaly with already known dimensions and depth. Optimized drilling investment.
Stage I halos + Stage II industrial bodies + structural network in a single georeferenced framework, ready to integrate into the client's GIS.
Four license zones, ≈ 11.6 sq mi (≈ 30 km²) of investigated area, 83 surface measurement points and 25 underground exploration points — the entire subsurface characterized at the 0.2% Cu threshold via remote NMR, without drilling any boreholes.
A mining operator in the Peruvian high plateau needed to expand the geological knowledge of its license area after several years of open-pit production. The question was direct: how far does copper mineralization extend around the existing operations, and at what depth?
Conventional tools — extensive diamond drilling campaigns — would have meant six to twelve months of field work, dozens of drilling rigs, opening of access roads through steep terrain and, above all, partial interruption of production in active zones.
Proprietary remote nuclear magnetic resonance was deployed across the four zones. Acquisition was completed in a few weeks, combining two modes:
83 surface measurement points along closed traverses (P, Q, R, T series) plus 25 underground measurement points (U-P, U-R, U-S, U-T) in zones with mineralization suspected from geological background. Result: full subsurface characterization — plan-view contours, depth elevations and structural network — without drilling a single physical hole.
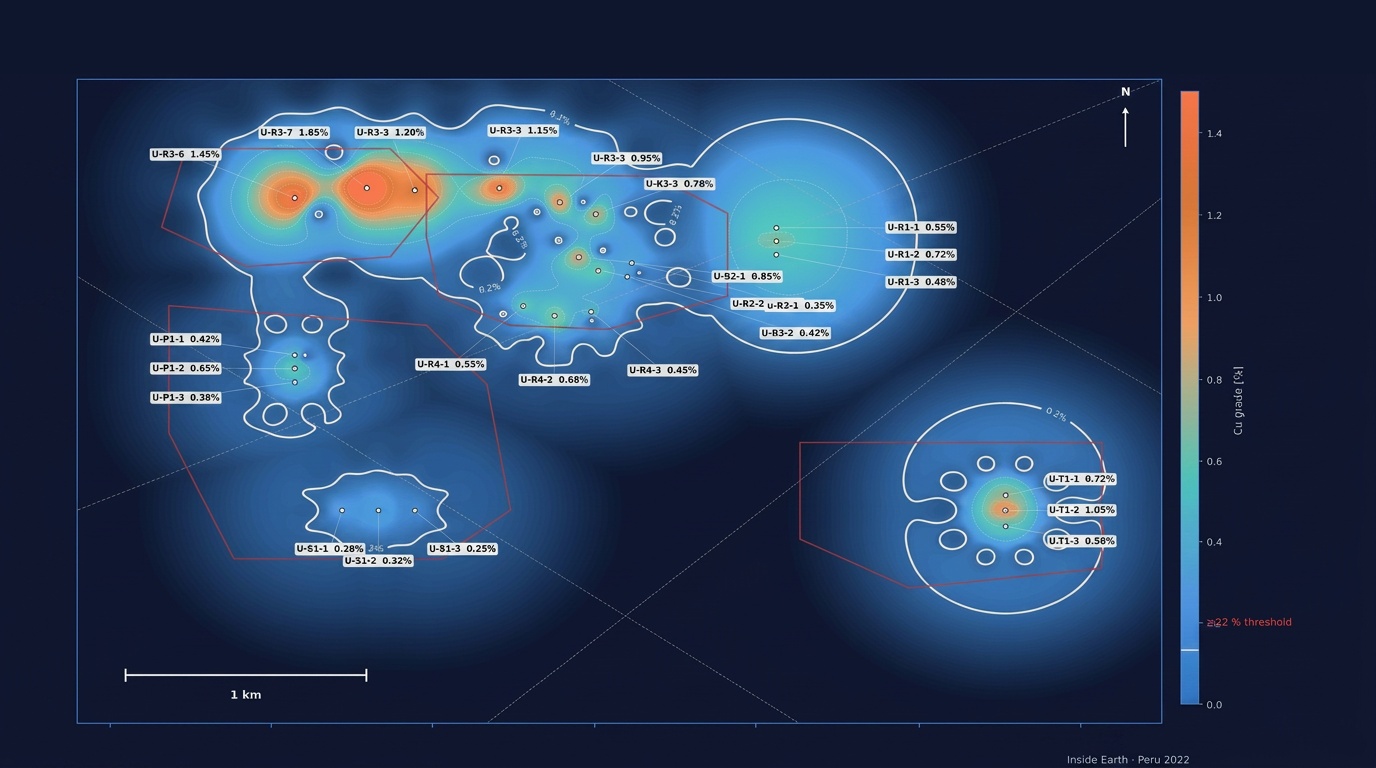
License polygons, the 83 measurement points, the 25 underground points, the 15 anomaly contours at the 0.2% Cu threshold and the fault network correlated with mineralization.
Boundaries of 4 license zones · 15 anomaly contours at CCu ≥ 0.2% · tectonic fault network
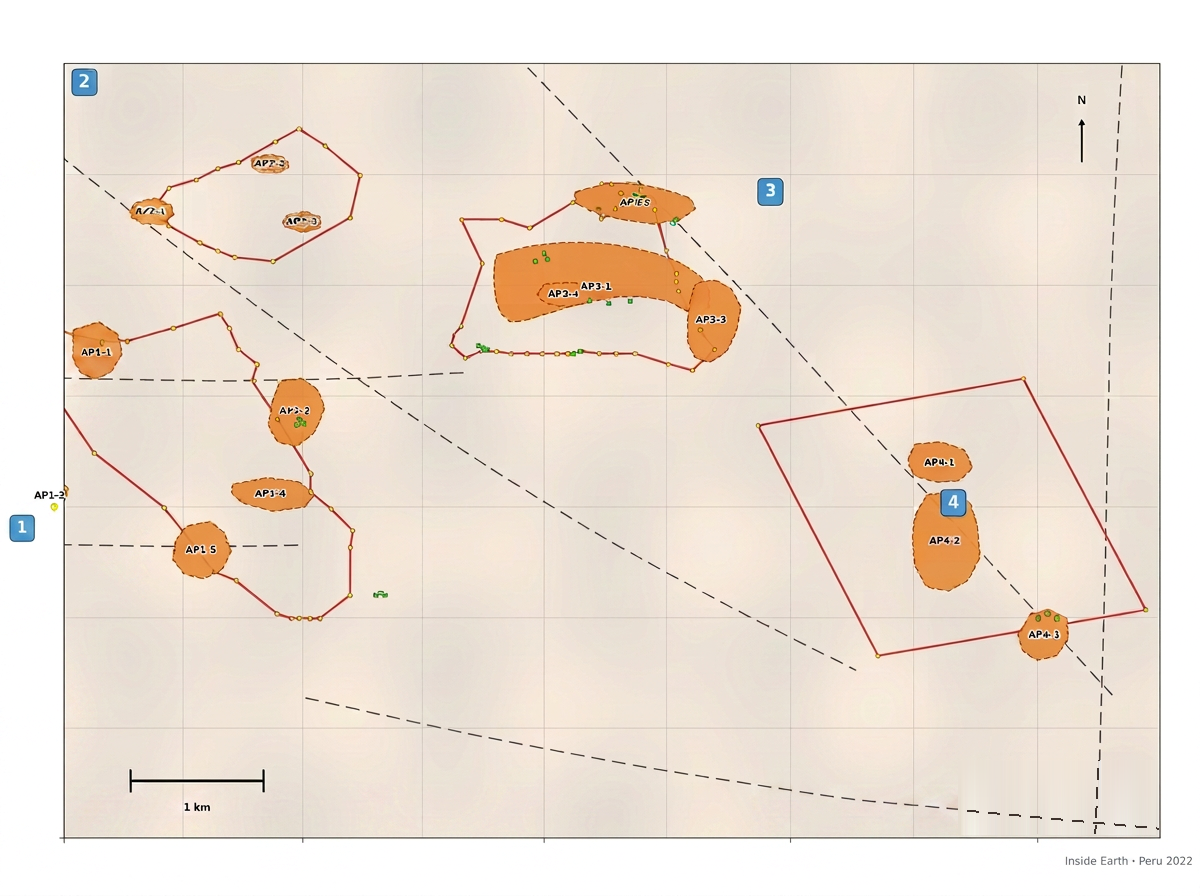
Five relatively small anomalies distributed along the perimeter of the zone — typical of a peripheral halo around the main body.
Three elongated lenses of moderate extent, aligned with the dominant structural direction. Associated with a main NW–SE fault.
AP3-1 is an arc ≈ 0.9 mi (≈ 1.5 km) long — geometry characteristic of a developed porphyry system. AP3-2, AP3-3 and AP3-4 accompany it as satellites.
AP4-3 shows stacked lenticular bodies extending down to 1,410 ft (430 m) depth — the deepest segment of the survey.
The 0.2% threshold appears as a thick white contour. The main hotspot concentrates in the western sector of AP3-1 — where R3-6, R3-7 and R3-8 exceed 1.2% Cu and reach a maximum of 1.85% — with a second isolated focus in AP4-3 to the south-east (core at 1.05% in T1-2).
IDW interpolation across 24 underground exploration points · scale 0 — 1.5% Cu · anomaly threshold ≥ 0.2%
Mineralization is defined by a top, a bottom and a geometry. The NMR analysis provided the vertical elevations for the most significant anomalies.
Annex 4 · 7 vertical sections through the AP1-2, AP3-1, AP3-2, AP3-3, AP3-4 and AP4-3 anomalies
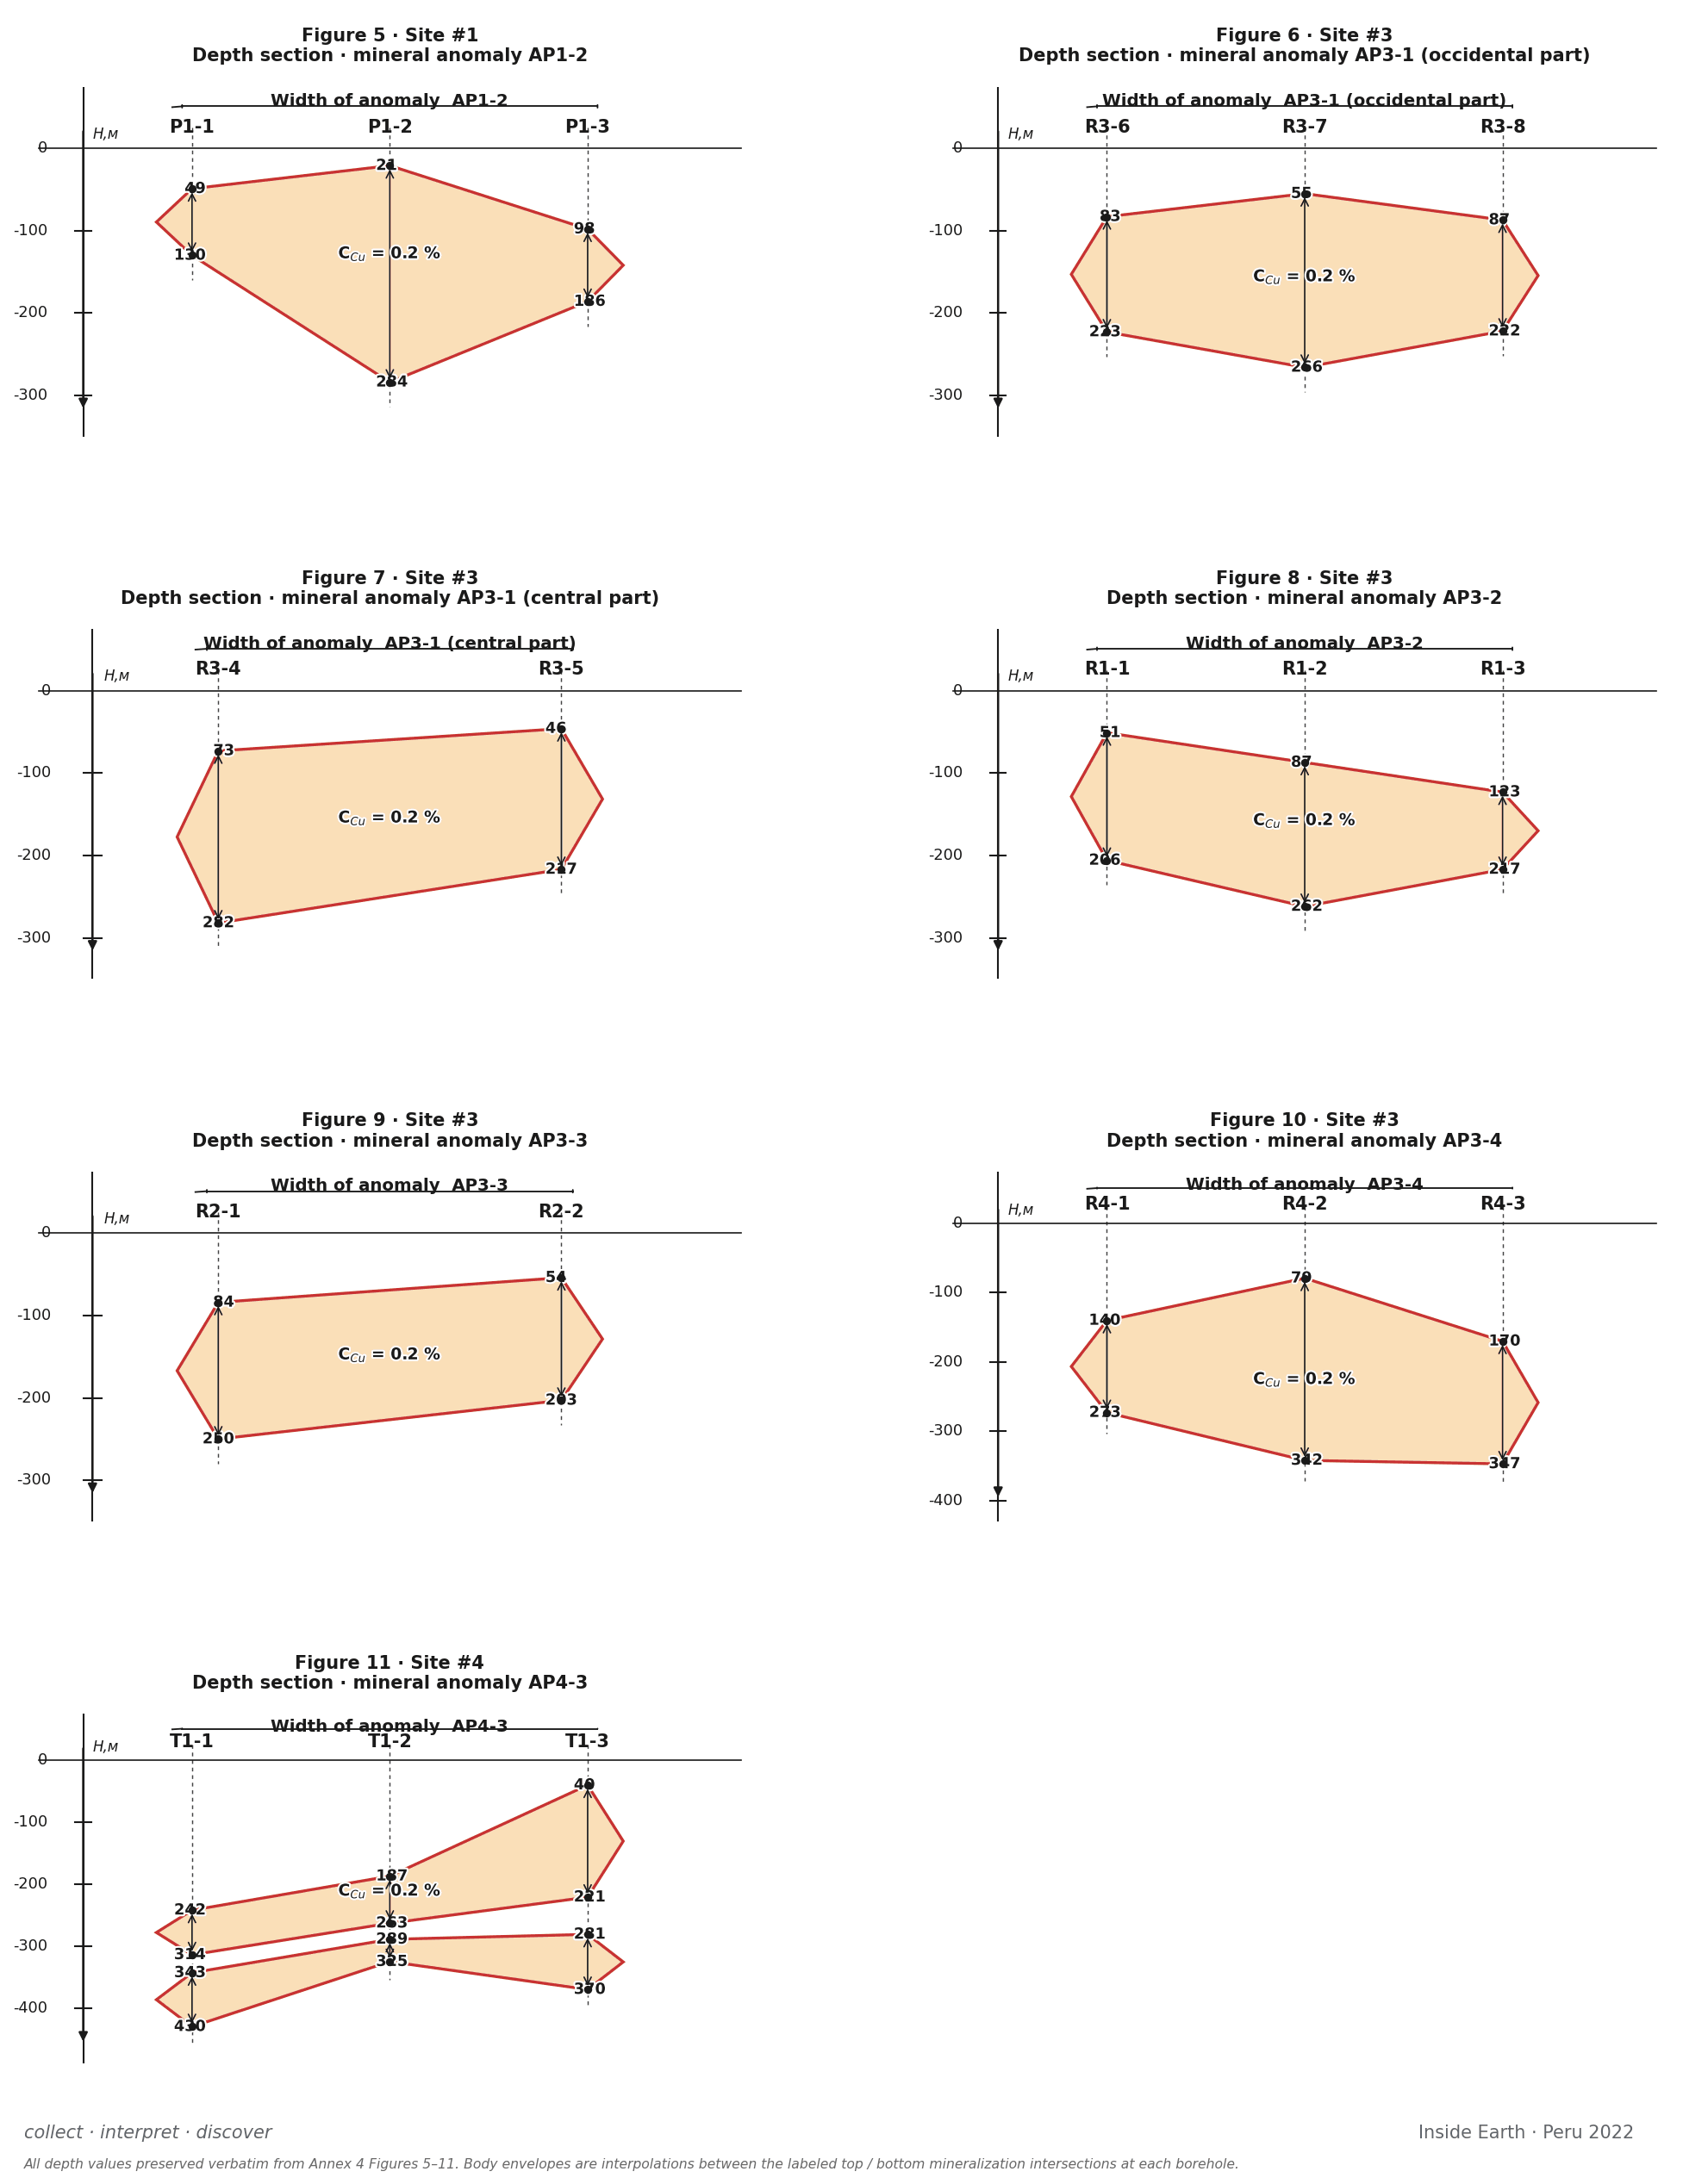
| Anomaly | Line | Top (m) | Bottom (m) | Thickness (m) |
|---|---|---|---|---|
| AP1-2 · Site 1 · Figure 5 | ||||
| AP1-2 | P1-1 | 49 | 130 | 81 |
| AP1-2 | P1-2 | 21 | 284 | 263 |
| AP1-2 | P1-3 | 98 | 186 | 88 |
| AP3-1 western · Site 3 · Figure 6 | ||||
| AP3-1 | R3-6 | 83 | 223 | 140 |
| AP3-1 | R3-7 | 55 | 266 | 211 |
| AP3-1 | R3-8 | 87 | 222 | 135 |
| AP3-1 central · Site 3 · Figure 7 | ||||
| AP3-1 | R3-4 | 73 | 282 | 209 |
| AP3-1 | R3-5 | 46 | 217 | 171 |
| AP3-2 · Site 3 · Figure 8 | ||||
| AP3-2 | R1-1 | 51 | 206 | 155 |
| AP3-2 | R1-2 | 87 | 262 | 175 |
| AP3-2 | R1-3 | 123 | 217 | 94 |
| AP3-3 · Site 3 · Figure 9 | ||||
| AP3-3 | R2-1 | 84 | 250 | 166 |
| AP3-3 | R2-2 | 54 | 203 | 149 |
| AP3-4 · Site 3 · Figure 10 | ||||
| AP3-4 | R4-1 | 140 | 273 | 133 |
| AP3-4 | R4-2 | 79 | 342 | 263 |
| AP3-4 | R4-3 | 170 | 347 | 177 |
| AP4-3 · Site 4 · Figure 11 (stacked bodies) | ||||
| AP4-3 | T1-1 upper | 242 | 314 | 72 |
| AP4-3 | T1-1 lower | 343 | 430 | 87 |
| AP4-3 | T1-2 upper | 187 | 263 | 76 |
| AP4-3 | T1-2 lower | 289 | 325 | 36 |
| AP4-3 | T1-3 upper | 40 | 221 | 181 |
| AP4-3 | T1-3 lower | 281 | 370 | 89 |
Vertical thickness in P1-2 (AP1-2) and R4-2 (AP3-4) — the lenticular bodies of greatest vertical extent recorded in the survey.
Mineralization detected at T1-1 (AP4-3, lower lens) — the deepest segment of the survey.
Mineralization detected almost at surface in P1-2 (AP1-2) — accessible without major stripping.
Those values correspond to a three-dimensional volume. Move the camera, toggle layers, and see how the 15 copper anomalies, 4 license zones, 83 surface measurement points and 25 underground points sit inside the 5.0 × 4.0 mi (8 × 6.4 km) block — with the 7 highest-priority anomalies reconstructed with their real top and bottom elevations taken verbatim from Annex 4. Depth reference planes every 328 ft (100 m), and three tectonic faults rendered as inclined planes.
Data shown is for illustrative purposes.
Volumetrically reconstructed; 7 with verbatim top/bottom from Annex 4.
Surface traverses P01–P27, Q01–Q15, R01–R37 and T01–T04 (4 series, closed loops).
U-points placed at depth on the prioritized anomalies — ready to lay out future campaigns.
Real depth profiles for AP1-2, AP3-1 W, AP3-1 C, AP3-2, AP3-3, AP3-4 and AP4-3 — without a single drilled meter.
Vertex-by-vertex coordinates of every anomaly contour at the 0.2% Cu threshold.
Top and bottom elevations for each mineralized body in the prioritized anomalies.
Tectonic fault network correlated with the mineralization.
Annex 5 with the exact position of each underground point, ready to lay out future campaigns.
Acquisition and processing in a fraction of the time of an equivalent drilling campaign.
No roads, no platforms, no muds — relevant in Andean territory with sensitive environmental conditions.
Field work in parallel with the active operation, without stoppages or equipment diversions.
De "queremos saber qué hay alrededor" a 15 objetivos con geometría conocida, listos para informar la decisión sobre dónde perforar.
Remote nuclear magnetic resonance also maps the deep gas sources and the migratory faults that feed firedamp into the galleries. Validated against real drilling data in Donetsk (2010) and Kuzbass (2022), with 98.4% predictive accuracy.
View accident preventionWhere an operation would benefit from rapid subsurface characterization without physical drilling, from shallow haloes to forecast resources at kilometric depth, the feasibility of the area can be assessed by the Inside Earth technical team in a first meeting, without obligation.